Skip to content
PROWERB
Services
Industries
Cases
Lab & Software
Company
DENeeds Check →
Services
Industries
Cases
Lab & Software
Company
LanguageDEEN
Start Needs Check →
PROWERB — Elevating Brands

Marketing Operations Backbone since 1979. Promotional products, logistics, kitting and digital commerce. One partner with its own operations in Kleve.

Elevating Brands — since 1979.Kleve · Düsseldorf · Dortmund · Lüdinghausen
Services
Logistics & fulfillmentPromotional products & merchandiseDigital commerce & marketplaceEvents & campaignsKitting, textile & ESGTech & AI
Company
About usLocationsHow we workSustainabilityCareersContactInternationalPress & news
Resources
GuidesInsights archiveGlossaryDownloadsTools & calculatorsCosts & calculationCompare operating models
Contact
PROWERB, Huissener Str. 7–947533 Kleve+49 (0)2821 7218-0info@prowerb.de
© 1979–2026 Prowerb GmbHLegal notice (German)Privacy policy (German)Terms (German)BrandDEEN

All rights reserved. Subject to change. Text and images on this website have in part been created or edited using artificial intelligence.

  1. PROWERB
  2. Services
  3. Technology, AI & marketing

Reporting & dashboards

See the figures your next decision needs.

Stock, orders and campaigns become understandable when sources and timestamps are clear. PROWERB aligns agreed views and reports with your tasks and data.
Discuss your project →Explore the details ↓
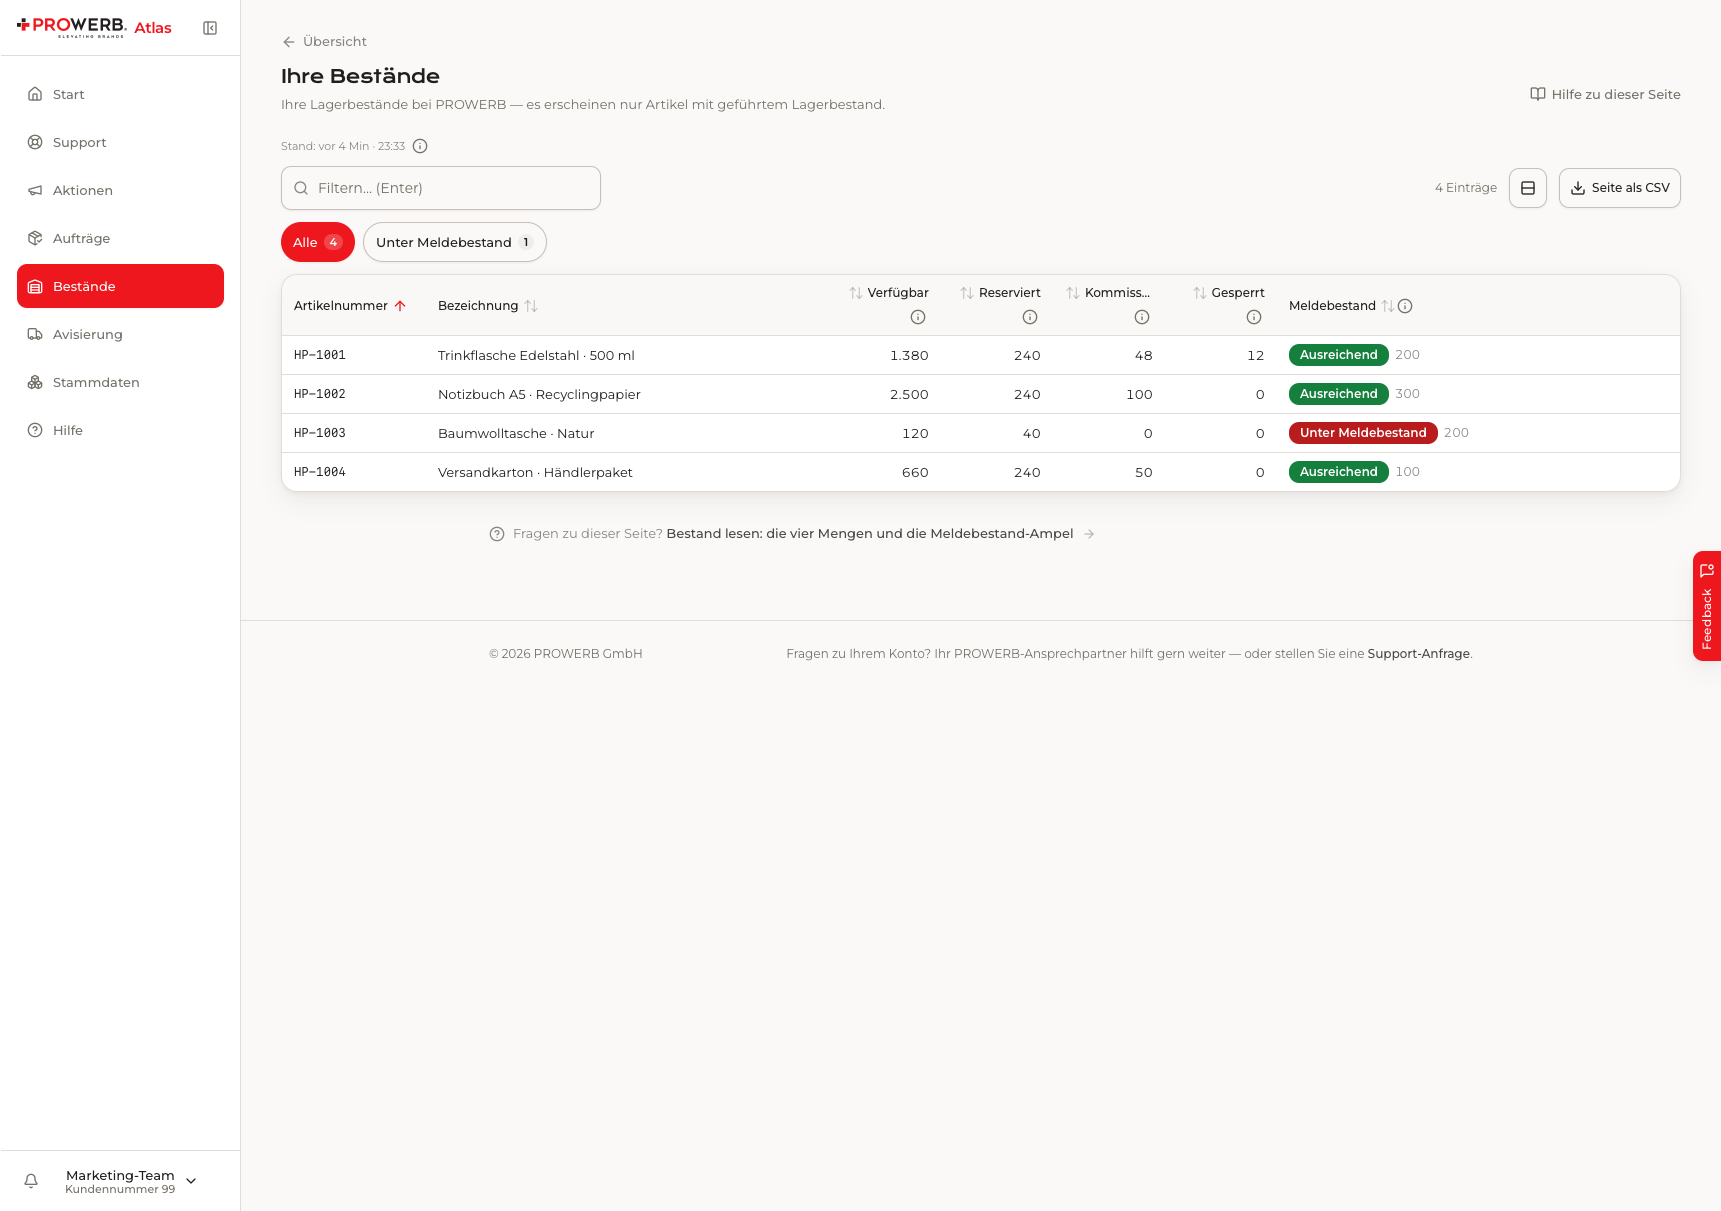
A view of products and orders in the German-language Atlas client portal.
A view of products and orders in the German-language Atlas client portal. Enlarge view

What we align for your project

Define the decision

Which question should the report answer?

Define the data

Specify sources, update frequency and the meaning of each value.

Agree the view

Review filters, access and presentation with users.

Platforms and their role

Power BI makes operational data usable. Metrics, filters, access and refresh behaviour are agreed for your account.

  • Power BIPower BI

    Reports and shared operational metrics

01 · Starting point

Useful reporting starts with the recorded event.

Goods movements and orders are recorded in PROWERB’s ERP and warehouse system. These operational data provide the basis for reports, exports and shared account reviews. The same reference should connect the stock movement, order and subsequent question.

For each view, we agree the source, meaning and refresh interval. A recorded warehouse event and an updated report are separate stages. The visible data timestamp helps the team assess whether a figure is current enough for the decision at hand.

Atlas & Nexus · PROWERB systems

Planning stays connected to fulfilment.

Atlas gives clients access to products, stock, campaigns and orders. Nexus supports operational processing. We agree the views and handovers needed for your project.

Explore Atlas and Nexus →
Example workflow

The campaign is planned. Is there enough stock?

A marketing team is preparing a campaign. In this example, available totes do not cover the planned call-off. The important information goes beyond the stock count: which units are already reserved, what replenishment is expected and when must the goods actually be ready?

The view connects the item to the affected campaign. That creates a clear task: confirm replenishment, adjust the call-off or approve an alternative. A report becomes useful when the decision returns to the operating process.

    02 · The cockpit

    Six views onto the same operation.

    The Operations Cockpit bundles data and reporting for customer brands — available around the clock, integrable into customer systems. The components:

    01Live reportsPower BI metrics with an agreed refresh interval and visible data timestamp, matched to the operational question.
    02Inventory trendsInventory per article over time, fed from the smooth real-time booking of our own ERP and WMS system.
    03Track-and-traceShipment status across the entire route — including direct mail to recipients, when delivery information should reach the addressee directly.
    04Budget controlSpend in view while the campaign is running — not only once the invoice reports it.
    05Automated Excel extractsFor teams that process data further: recurring extracts, automatically generated and delivered.
    06Ad hoc notifications →Events report themselves — instead of surfacing only at the next reporting date.
    03 · Data path

    Read data origin and freshness together.

    Every view needs a defined source, update cadence and responsible recipient. The latest data timestamp and open discrepancies are part of interpretation. A display does not replace approval: actions are decided in the responsible operating process.

    Data view

    From data source to decision

    1. 01SourceOrder, inventory or dispatch event with a business reference.
    2. 02ReconcileCheck completeness, assignment and open discrepancies.
    3. 03RefreshShow the agreed cadence and latest data timestamp.
    4. 04ViewDefine metric, period and access for the relevant role.
    5. 05ActionAssign an owner and date; check the effect in the next update.

    A dashboard is an analysis. Booking, approval and correction remain in the responsible operating process; live views and periodic exports may have different timestamps.

    What this shows

    Identify the origin and freshness of figures.

    04 · In ongoing operations

    The same numbers on both sides of the table.

    Clients and account teams use the views released for their roles. In a review, a discrepancy is assigned to a specific action with an owner and date; the next data update shows whether the action worked.

    05 · Proven

    Coca-Cola: reporting within the mandate since 2021.

    At more than 2 million shipments a year, reporting that waits to be asked for is too slow. That's why transparency at PROWERB is part of the mandate, not an add-on:

    Coca-Cola Europacific Partners
    Logistics for all POS items for retail and gastronomy, handling of all promotions, VIP ticketing, event logistics — with reporting around the clock and control of all brands via digital ordering platforms.
    Our own systems behind it
    PROWERB CORE, MEP platform, PROFLOW APC, data lake: the tech stack the reports come from is the same one that runs operations.
    06 · Related services

    Reporting is the read view of the other services.

    The data in the cockpit is generated in the adjacent service areas:

    01MEP platform →Promotion planning, campaign configurator, shipment-list upload — the portal where much of the data originates.
    02GPS tracking →Our own tracking technology for shipments and event equipment — the location data appears in the same cockpit.
    03Promotional products fulfillment →Warehouse, pick & pack, dispatch: the operation the inventory and shipment data represent.
    04Print-data approval workflow →Approvals and correction rounds run in a documented way — traceable like the rest of operations.
    05cs Communication Intelligence →The analysis of service correspondence — transparency into what happens alongside the systems, too.
    Before we start

    What we agree before starting.

    These decisions define scope, responsibilities and acceptance.

    What does current mean?

    Posting, data transfer and report refresh are separate steps. The agreed refresh interval and visible data timestamp belong in acceptance.

    Who needs which view?

    Management, procurement and operational teams need different detail. Agree roles, export permissions and granularity before configuration.

    What should a warning trigger?

    For each material deviation, agree the recipient, threshold and expected response. A red number then becomes an actionable task.

    07 · FAQ

    Frequently asked questions about reporting and dashboards

    How current is the data in the cockpit?

    The source is the recording of operational events in the ERP and warehouse system. Data transfer and report refresh follow the agreed configuration. Before launch we agree the required interval and how the latest data timestamp is shown.

    In what form do we get the reports?

    As live reports on a Power BI basis in the Operations Cockpit and as automated Excel extracts for further processing. Supplemented with ad hoc notifications when an event shouldn't wait for the next report.

    Can the reporting be integrated into our systems?

    Yes. The Operations Cockpit is integrable into customer systems; connecting existing online shops, ERP and WMS systems via the MEP platform is part of the standard repertoire.

    What do we see besides warehouse inventory?

    Inventory trends over time, track-and-trace through to the recipient including direct mail, budget control, and the live KPIs of ongoing operations — including during campaigns.

    Is the reporting an add-on module?

    It's the read view of the systems that run operations anyway. Which views your mandate needs depends on assortment, channels and campaign rhythm — the scope is set in the briefing.

    Who at PROWERB works with these numbers?

    Account management across three levels — Key Account, AM Promotions, AM Fulfillment — works on the same data basis as you. Customer and provider discuss on one shared set of figures.

    Related topics

    These pages fit too.

    • 01Tech & AI
    • 02Order-to-Cash: Order Processing in Ongoing Operations
    • 03Promotional-Products Fulfillment: Pick, Pack & Ship
    • 04POS & Display Logistics: Campaign Logistics on Schedule
    Briefing

    Tell us which number you're missing today.

    In the briefing, we clarify assortment, channels and reporting needs — and what view the Operations Cockpit would give you of your operations. After that, you'll know what transparency looks like when promotional-products operations and an in-house tech stack run under one roof.

    Request a callback
    Your contact replies within 24 hours on business days.